Statistics Comparisons
On this page, we’re going to examine pairings of similar stats. Both are important, but the goal is to determine what statistic front offices value more.
We begin by comparing WAR3 (wins above replacement accrued over the past three years) and WAR accrued during the player’s contract year. The contract year is the year directly before the player’s existing deal expires and he becomes eligible for free agency. This comparison essentially boils down to the question of consistency or recency. Would teams prefer a player who has very good over the course of three years, or would they rather have a player who hasn’t been as consistent but had a better last season? Note that these variables, like many baseball stats, are not independent. The WAR accumulated in a contract year is included in WAR3.
According to the graph, WAR is valued slightly more. The equation of the line of best fit can be interpreted to say that a 1 win increase in WAR is associated with a roughly $17 million increase in the total contract, on average. For WAR3, that number drops to about $9.5 million. The correlations are both very weak, however, with R^2 values of .25 and .23, respectively.
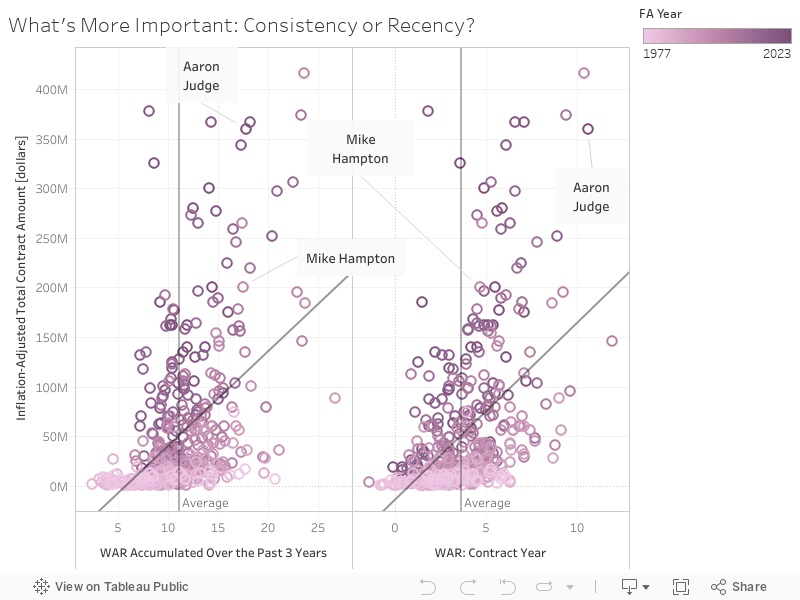
Looking at the graph more closely shows instances of teams caring about both predictors. Over the three years before he became a free agent, Aaron Judge accrued 17.8 WAR, about 6 WAR per year. That’s good, but not MVP-caliber. Compare that to his 2022 season, where Judge finished with an absurd 10.6 WAR and won the MVP award. Take into account that if 10.6 WAR came in 2022, then he only accrued 7.2 WAR over the two seasons prior. In the offseason, Judge re-signed with New York for $360 million, a number that was definitely a result of his otherworldly 2022.
Pitcher Mike Hampton experienced the other end of the spectrum when he became a free agent after the 2000 season. Hampton was second in NL Cy Young voting in 1999, but his season in 2000 was less impressive. He did not get any Cy Young votes and didn’t make the All-Star team. However, Hampton was able to parlay his success and consistency over the past three years into a $121 million contract with the Rockies, the largest contract ever for a pitcher at the time.
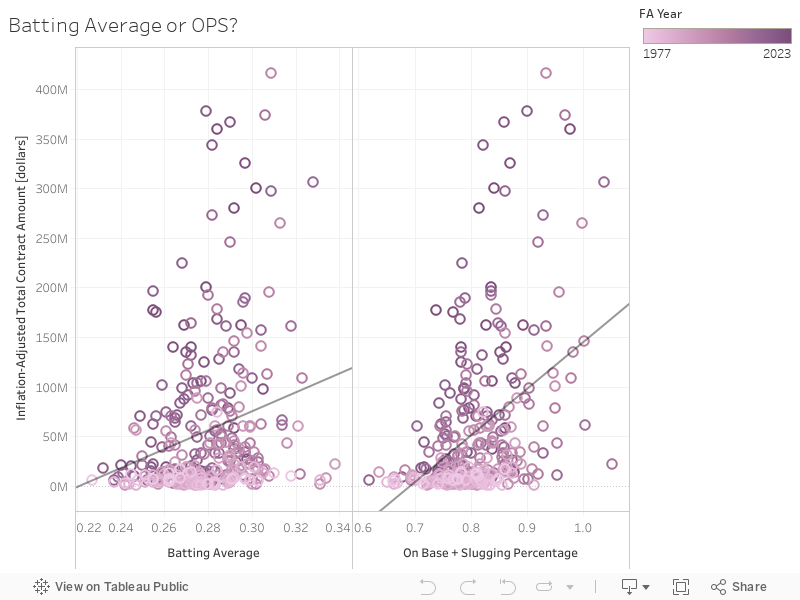
Next, let’s turn our attention to hitters only as we compare batting average and OPS (on base + slugging percentage). Batting average is the tried and true hitting metric. It’s been around forever, and it’s often the first thing that comes to mind when measuring a hitter’s performance. However, the rise of analytics has brought OPS to the forefront of baseball. It’s thought to be the best way to sum up a hitter with one number because it accounts for power and the ability to get on base.
The best conclusion we can draw from this plot is that batting average alone is not a good predictor of a contract amount. The R^2 value of 0.05 indicates there in next to no correlation between the two. OPS does better with a correlation coefficient of 0.18, but that is very weak, too. So while it’s hard to say which is more important for a large contract, we can acknowledge that OPS is a better predictor than batting average.
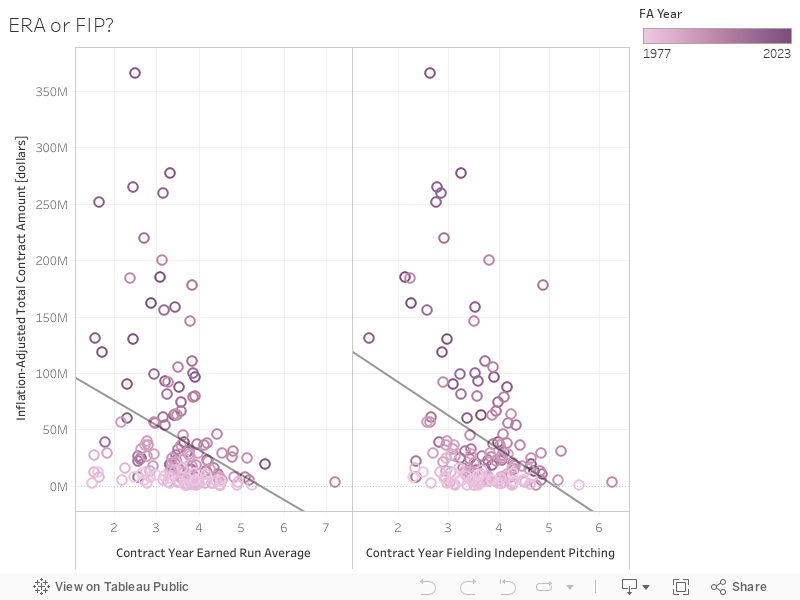
We end our exploration of visualizations by closing with pitchers. Earned Run Average (ERA) and Fielding Independent Pitching (FIP) are very similar stats. Both are designed to measure a pitcher’s performance on the same scale, but FIP removes the influence of defense. The thinking behind FIP is that if a pitcher has a really good defense, that defense may save him from allowing runs and make him look better than he actually is. FIP eliminates the defense to try to more accurately portray how effective a pitcher is.
Much like the other predictors measured on this page, ERA and FIP alone are not good predictors. The R^2 values are much too low. The regression line does indicate that FIP is a more important predictor. According to the equation, a 1 point increase in FIP is associated with about a $29.5 million decrease in contract amount on average, while that number changes to roughly $22 million for ERA. Lower FIPs and ERAs are better, so it makes sense that an increase in these stats would yield a lower contract.